Just a tiny experiment with Flux.io
a.k.a. how the hell did you manage without Flux all this time? When it comes to software and architecture, you have software that is considered to be cool and software with popularity issues. As a recently published case study demonstrates, Rhino and Grasshopper are still considered to be cool, but like medium-cool, like that chick who used to […]
a.k.a. how the hell did you manage without Flux all this time?
When it comes to software and architecture, you have software that is considered to be cool and software with popularity issues. As a recently published case study demonstrates, Rhino and Grasshopper are still considered to be cool, but like medium-cool, like that chick who used to be the most beautiful in college but now has to continuously say how ugly that girl from 1st grade is. Now, Revit might not be a girl from 1st grade, but I like to think that its popularity is rising also among the computational freaks (I love you guys) also thanks to Dynamo.
But I digress.
My original point was that yes, you have software with popularity issues.
And then you have Flux.
![]()
Flux has everything.
It’s aesthetically appealing for all those architects out there, and it has amazing interface.
It’s free.
And it’s Google.

I’ll walk you through it, and then you’ll tell me if you’ll ever be able to work without it again, deal?
What I am not going to do is explaining how Flux works at a very basic software level. For that, you have this article by incredible blogger Andrew Ray and there really isn’t a better way to explain it.
What I am going to do, though, is provide you with a real-life situation and explore with you how Flux might have been used.
Nothing too serious, I promise.
And there’ll be at least one kitten.
1. Start with a brief
When it comes to architecture, you so rarely start with an idea. What you start with, is a brief. A serious brief is usually made up of a complex system of data, and if you managed to hear us speaking lately you might remember how much we would like for this data to be organized in some shape that we can feed Revit with.
Now, for this little test I took a very simple brief.
As some of you might remember, a while ago I did the project coordination for the renovation of the Factory Museum for one of Italy’s most known and loved design companies. They make plastic chairs unsuitable for your garden, if you get my drift.

At a certain (late) point of the project, an additional request came from the client and we had a little trouble to absorb it, being completely engaged in other activities. On the wall of the museum cafè, the client wanted to exhibit some of the prices the Company had won during the years, and they were like 60 exhibits, in different dimensions and shapes, to be put into frame and organized in a composition. Now, drawing 60 rectangles in Vectorworks and associate them with their picture is long and boring. In Revit (with a little help from Dynamo and a couple of beers) all I had to do was creating one single parametric family, and work on a script that looked a little bit like the one below.

In this, Flux is not game-changing, meaning that it doesn’t do anything you weren’t able to do before with a little creativity.
Still.
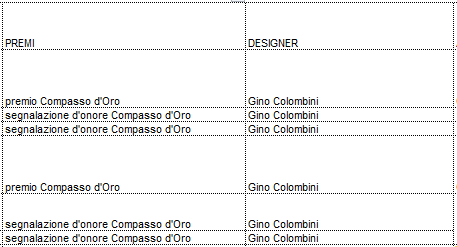
Let’s say that you have an Excel list of 60 items with information such as item measurements and descriptions. As usual and even if I’m stating the obvious, first of all you should check that each column contains one and only one information. See for instance the screenshot below.


Another thing you should look for, is the presence of merged cells. Merged cells look pretty but don’t play well with practical usage of data. It doesn’t matter that you have the same text twice: nobody will care if your table looks nice but it’s not usable as a source of data. Trust me. Again, see screenshot below.

2. Set up your Flux project
Time to get into Flux.
Once you’ve registered (easy as pie), setting up a new project is equally easy.

Now your project needs to be filled up with Keys. You might want to start by creating one key for each column you have in your spreadsheet. Just saying.

3. Throw the brief into Flux
Once you’ve polished your data within Excel and created all your Keys within Flux, all you should do is install the Flux plug-in for Excel. It’s free and it provides you with an additional tab in your Excel sheet.

You might notice a button that says “To Flux”.
Provided you already registered and created a project (come on, it’s not that difficoult), you get a window in which you can:
– specify the data range, so you don’t have to create specific pivot sheets in order to send your data to Revit: you can specify a range of cells (absolute or relative using $, as always happens in Excel);
– select your Flux project name among a drop-down list;
– specify a Key name among another drop-down list.
Now, Keys are to be regarded as the blocks of a visual scripting. If you’re unfamiliar with what I’m referring to, I suggest you check the Tutorial for Beginners.
Recall that data keys are the means by which external applications can send and receive data with a Flux project.
Anyway, just remember that you need to send data to an existing key and you can’t create them from the Excel menu. If you try to do so, by manually writing a new name instead of selecting an existing Key, you’ll get the error below.

Edit: as they correctly pointed out on Twitter, you actually can create new keys by selecting the correct option. My bad.
What you’ll also be asked to say if data should constantly flow from your Excel sheet to Flux or if you want to update manually each time you feel like doing it.

Your side tab will get “populated” with connections and you’ll be able to refresh them at any time by moving your mouse over it.


4. Check what’s happening
What you’ll get in Flux is something that looks a little bit like the screenshot below. You have basically uploaded your list of values into what Flux calls an “array”. The little symbol on the lower right of the key indicates where those value come from. If you drop keys into the data window, you’ll get a preview of their values, like the one below.

You also have the option to download your set of data in JSON format and… oh, come on, don’t panic. As a Revit user you should be familiar with the XML format Revit uses to export some of your schedules and reports. JSON is just a competitor format who works in the same way.
Just keep in mind that the Data tab is just a preview tab. Nothing gets done here.
The Flow tab is to get things done so let’s get something done, ok?

4. From Flux to Revit (via your next best friend)
Yes, you need to use Dynamo. Therefore you need to install it (obviously) and to install the related plug-in. You’ll get a whole new set of nodes, looking like this.

They work in a very basic way: each time you need to do something, you need to set the category of what you’d like to act on (project or key, for instance) and then select it from one list.
For instance, this is what the sequence looks like if I want to pull from flux all the values associated with the Width of the frames.

Now, you might need to do a little thing first and you can either do it in Flux or in Dynamo, and this little thing is to flatten your list. I don’t know how to make it simple if you’re not familiar with the concept, but I’ll try. Just take a look at what Flux does, given the original list as an input and the instruction to flatten it as “instruction”.

Clear, right?
Once you’ve performed an instruction such as this, you can take the new “key” (Flatten Width, in this case) and send it to an exhisting data table. The corresponding key will get the blue icon of Flux, meaning it’s a set of information you’ve compiled directly in Flux.

In Dynamo, you have the List.Flatten node. Same thing.

I personally suggest you do it in Flux: I’ll explain the reasons later.
5. Feed the parameters
Now, I was at this point. Frames were placed automatically based on the number of rows in the excel, with another script I can’t disclose. You can place them with a simple array: no issue there.

Families have instance parameters for Width and Height. I feed them values from Flux. They change shape. Magic.

All you need now is somebody to play around with them, and you’ll get this.


The nice thing is that you can provide your designers with a set of families already in the right shape and size. They don’t need to do data entry. Things are smoother, everybody’s happier.
6. Why not just Dynamo?
Now, I know what you’re thinking. It’s nothing you couldn’t do without Dynamo itself. Correct. You have the Excel read from file and write to file nodes. I believe I’ve displayed a couple of uses before.
.
 .
.
Why I prefer Flux, you ask?
Well, for instance the Excel.ReadFromFile nodes asks you to remember stuff, and you know how bad I remember at that. Flux is actually integrated with Excel and Dynamo: you can select existing stuff instead of trying to remember what they were called like.
Second and most important, it’s like having Dynamo in the cloud. And to me this is one huge piece of improvement.
And what if I told you that you can manage the whole process within Flux, including the family creation? Just take a look at the Revit portion of Flux library.


7. Going back: from Revit to Flux
What I intentionally showed you is a hybrid workflow: a little bit of Excel, a little bit of Flux, a little bit of Dynamo and then Revit.
With the Revit plugin for Flux, you can actually drop a lot of workarounds, including Dynamo. Let’s say you like to export data from a set of families, and let’s say they are some of the pieces on display in that very museum I was talking about before.

Install the plug-in and you’ll get an additional tab, as usual.

What’s very interesting is the window you’ll get when you push the “To Flux” button.

You can set up the elements you want to send to Flux (let’s say, all elements within the “Furniture” category”), and then the Project and Key you want to set data to.
Within Flux, you’ll get a key with the Revit logo. It’s pink. Don’t ask me why.

This data key will be seen from Excel when you pull data from Flux.
Bottom line: you can send data from Revit to Excel without Dynamo and without any plug-in.
You can control multiple Excel sheets connected to your Revit model, all from the same web interface.
In this situation, I used it to connect the prices to the actual items the prices were won for. And to export everything to a single Excel sheet mapping the museum catalogue. Ultimately this could become the actual museum catalogue, interactive in the real sense.

And we might really have something usable by the Facility Management, something that can be thrown back into our Revit model without them even knowing it.
A whole world of new opportunities opens up.
And it’s for free.
PS: if you haven’t seen the museum, go and see it. It’s amazing. And equally for free.

Good post! I read your blog often and you always post excellent content. I posted this article on Facebook and my followers like it. Thanks for writing this!